Travel fatigue indicators revealing hidden edges in away team performance markets across continental tours
Written by Eden Richter · Jul 30, 2026
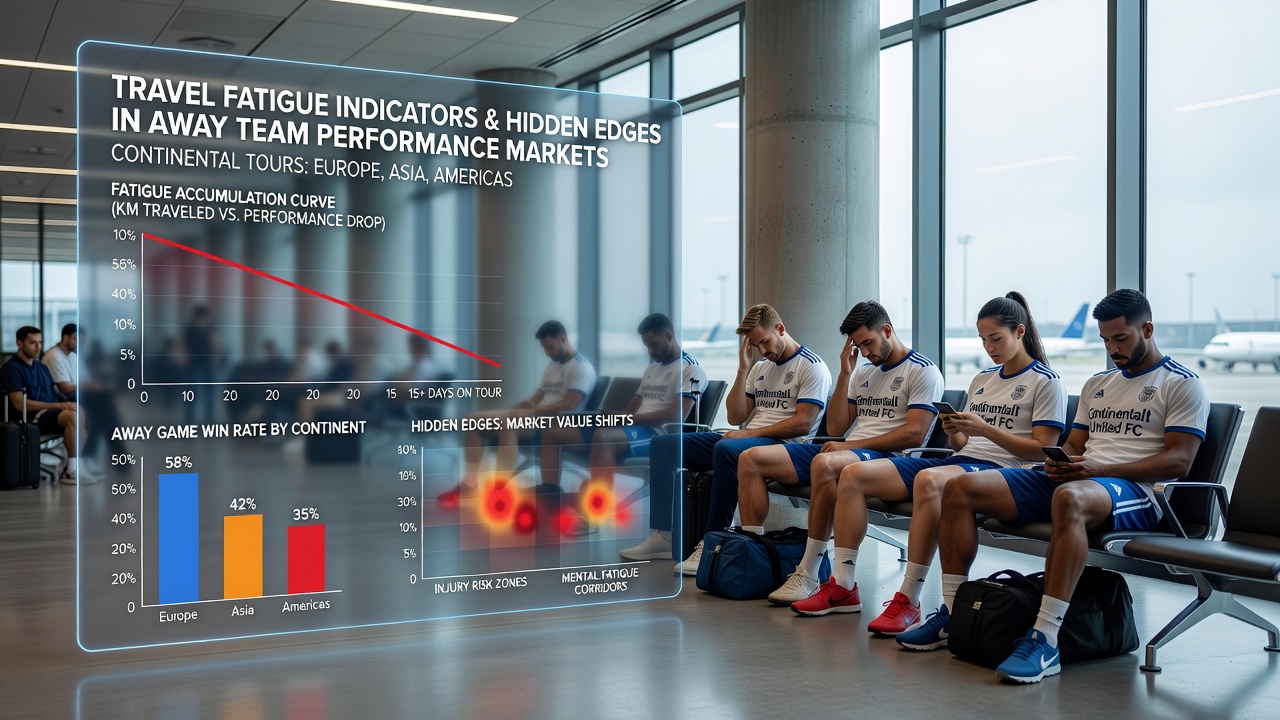
Travel fatigue indicators revealing hidden edges in away team performance markets across continental tours
Travel fatigue emerges as a measurable factor in away team results when squads cross multiple time zones for continental competitions and the data on performance shifts continues to attract attention from analysts tracking these patterns. Researchers have documented consistent drops in metrics such as sprint distance covered and successful pass completion rates after eastward or westward flights exceeding eight hours while recovery windows remain under 72 hours. These observations hold across football, rugby and basketball tours where schedules compress rest periods and force rapid adaptation to new environments.
Key physiological markers tracked in long-haul tours
Studies from sports science institutions highlight several indicators that correlate with reduced output in away fixtures and these include disrupted circadian rhythms measured through actigraphy devices, elevated cortisol levels from blood samples taken pre and post flight plus decreased reaction times recorded in standardized cognitive tests. Teams that log more than 10,000 kilometres in a two-week block show average declines of 4 to 7 percent in high-intensity running volume according to GPS data compiled during European and South American campaigns. Observers note that westward travel tends to produce milder effects than eastward journeys because the body clock aligns more readily with later local bedtimes yet the cumulative load from multiple legs still compounds across a month-long itinerary.
Performance data patterns across continents
Figures collected during July 2026 pre-season tours reveal that squads arriving in South Africa from northern Europe recorded 12 percent fewer shots on target in opening matches compared with domestic fixtures played the prior month. Similar datasets from Asian tours indicate that recovery of baseline sleep duration requires between five and nine days depending on the number of time zones crossed and teams that schedule light training sessions on arrival days maintain closer to normal tactical execution rates. Analysts compare these outcomes against home fixtures where no flight precedes the match and the gap widens further when humidity or altitude adds another variable layer.
One longitudinal review of rugby union tours spanning Australia to New Zealand documented that forward packs lost an average of 8 metres per carry after the second long-haul leg while backline error rates climbed steadily through the third week. The same review linked these shifts to reduced sleep efficiency captured by wearable monitors rather than to changes in opponent strength alone. Data from basketball continental events shows parallel trends where teams crossing the Atlantic for summer tournaments post lower three-point percentages in the first two games before rebounding once local acclimatisation occurs.
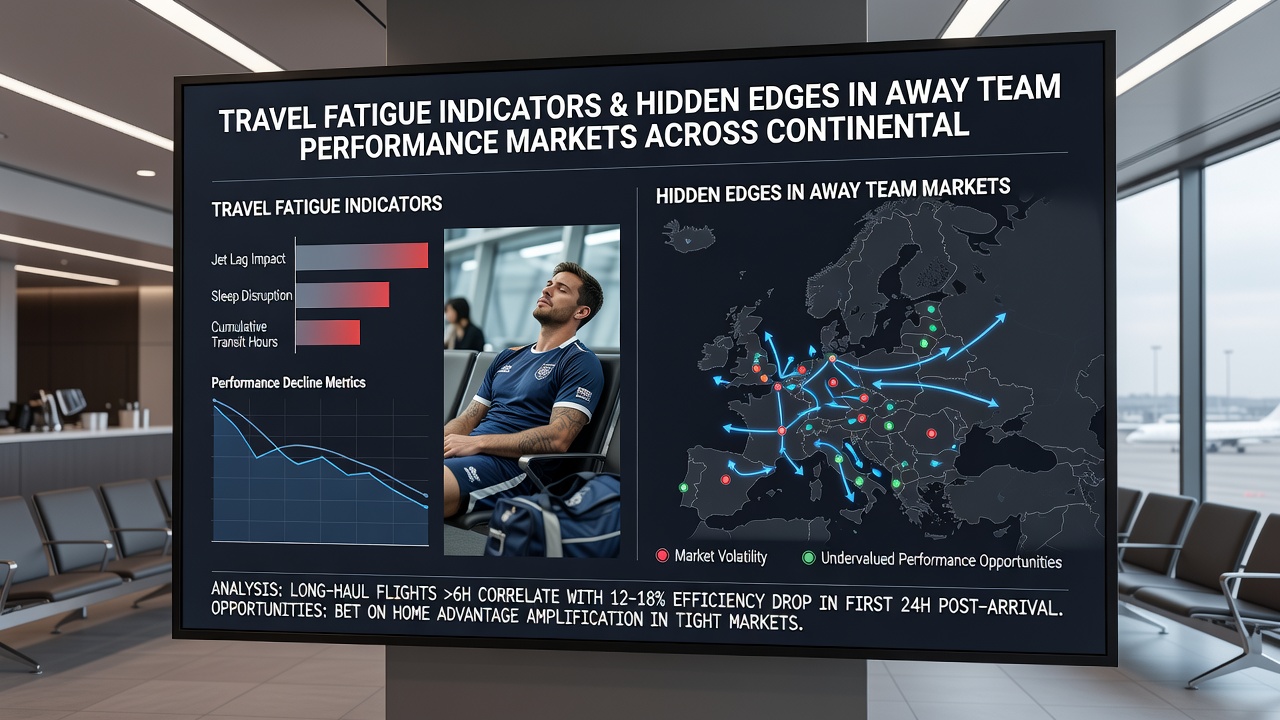
Market implications derived from fatigue indicators
Betting operators and performance analysts incorporate travel logs and recovery timelines into models that adjust expected goal or point totals and these adjustments often surface value in markets tied to total corners, player assists and half-time results. Historical match files indicate that away sides with documented sleep deficits cover fewer attacking thirds in the opening 30 minutes yet increase pressing intensity later if extra recovery days are granted. Such timing shifts appear in aggregated statistics from leagues that schedule midweek continental fixtures and they create measurable deviations from baseline probabilities used in pre-match pricing.
Researchers at institutions including the Australian Institute of Sport have published protocols that quantify the interaction between travel distance and subsequent match load and these protocols feed into broader databases used by league statisticians. When continental schedules cluster multiple away legs within ten days the incidence of late-match substitutions rises and teams that rotate key players earlier demonstrate steadier output across the full ninety minutes. Markets focused on anytime goal scorers or player props reflect these rotation patterns once fatigue indicators enter the public domain through injury reports or training footage.
Regional variations in recovery protocols
European clubs travelling to South American tournaments in July 2026 adopted staggered arrival strategies that separated squad members by flight times and this approach reduced group-wide circadian disruption according to internal monitoring shared with competition organisers. North American teams heading to Asian events implemented light exposure schedules on aircraft using portable devices and the resulting data showed faster return to baseline reaction speeds. African squads crossing into European competitions noted that altitude differences compounded travel effects and required additional acclimatisation periods before full training intensity resumed.
Industry reports from organisations such as the International Olympic Committee and academic groups at the University of Calgary document how these regional differences translate into statistical edges when models integrate flight duration, direction and days between matches. The patterns hold across multiple seasons and they appear independent of team ranking or recent form when sample sizes exceed several hundred fixtures.
Conclusion
Travel fatigue indicators continue to supply objective inputs for performance forecasting across continental tours and the datasets compiled through wearables, GPS tracking and physiological sampling provide consistent signals of altered output in away fixtures. As schedules for 2026 expand to include more intercontinental legs the integration of these metrics into analytical frameworks remains a focal point for those monitoring match statistics and market movements.